
Data visualisation and business intelligence are essential components of modern business operations. Companies rely on data-driven insights to make informed decisions. Tableau is the ultimate data visualisation and business intelligence tool.
Tableau helps businesses analyse, visualise, and share data to drive better business outcomes.
In this blog, we’ll closely examine Tableau’s features, benefits, and use cases.
What is Tableau?
Tableau is a business intelligence and data visualisation tool that allows users to create interactive and visually appealing dashboards, reports, and charts. It provides an intuitive drag-and-drop interface that allows users to easily connect to various data sources, manipulate and analyse data, and create visualisations in real-time.
Tableau supports multiple data sources, including spreadsheets, databases, cloud services, and web-based data. It also offers data blending, preparation, and forecasting features to help users make data-driven decisions.
In today’s world, data is more critical than ever before. Every organisation, big or small, needs to make data-driven decisions to succeed. But with so much data available, it can be overwhelming to make sense of it all.
That’s where Tableau comes in.
Features of Tableau
- Drag-and-Drop Interface: You can quickly create visualisations and reports in Tableau without coding or technical skills.
- Data Blending: Tableau allows you to blend data from multiple sources to view comprehensively.
- Real-Time Analytics: Tableau provides real-time analytics capabilities, allowing you to analyse data as it changes.
- Interactive Dashboards: Tableau provides interactive dashboards that allow you to explore data and gain insights.
- Collaboration: Tableau provides features allowing you to share your work with others and collaborate on projects.
- Mobile Support: Tableau provides mobile support, allowing you to access your data and visualisations from anywhere, at any time.
Benefits of Tableau
- Better Data Insights: Tableau allows you to quickly and easily analyse your data, providing better insights into business operations.
- Improved Decision-Making: Tableau’s data visualisation capabilities allow you to make better decisions based on the insights gained from your data.
- Increased Efficiency: Tableau’s drag-and-drop interface and real-time analytics capabilities allow you to quickly and easily create visualisations and reports.
- Cost-Effective: Tableau’s pricing model is flexible and scalable, making it a cost-effective solution for businesses of all sizes. To elaborate, Tableau has a range of products like Tableau desktop, Tableau server, Tableau cloud, CRM Analytics, Tableau public etc. Tableau allows you to mix and match products and customise the license to meet your requirements.
Our Products | Harness the power of your data for everyone
Tableau Lifecycle
- Data preparation: Data preparation in Tableau refers to cleaning and transforming raw data into a format suitable for analysis and visualisation in Tableau. The raw data source can be Excel, database tables etc.
- Visualisation Design: This may include selecting the type of chart or graph to use, as well as configuring the appearance and layout of the visualisation.
- Development: In this stage, the visualisations are created using Tableau software (like Tableau desktop and Tableau cloud). This may involve creating multiple views or dashboards and configuring interactivity and data filtering.
- Testing: Once the visualisations have been created, they should be thoroughly tested to ensure they are accurate, reliable, and user-friendly. This may involve running simulations or using test data to verify that the visualisations are working as expected.
- Deployment: In the final stage of the life cycle, the visualisations are deployed to the intended audience. This may involve publishing the visualisations to a Tableau server or other web-based platform or distributing the visualisations through other means such as email or printed reports.
The Cycle of Visual Analysis – Tableau
Multiple Use Cases where Tableau can be used
- Sales and Marketing: Tableau can track sales performance, analyse customer data, and create marketing dashboards.
- Finance: Tableau can analyse financial data, create budgeting reports, and track financial performance.
- Healthcare: Tableau can track patient outcomes, analyse healthcare data, and monitor operations.
Devoteam Use case: Healthcare Accelerator, new Smart Device solution – Devoteam S Platform
- Retail: Tableau can track sales performance, analyse customer data, and optimise inventory management.
Devoteam Sustainability use Case
At Devoteam, we have used Tableau to visualise a use case related to Retail Industry Emissions.
In the use case, we will visualise the emissions data from the retail industry. To elaborate, a luxury fashion retailer with numerous superstores worldwide sells fashion products like Jeans, t-shirts, caps, shoes, and winterwear. In the process, it contributes to daily carbon emissions.
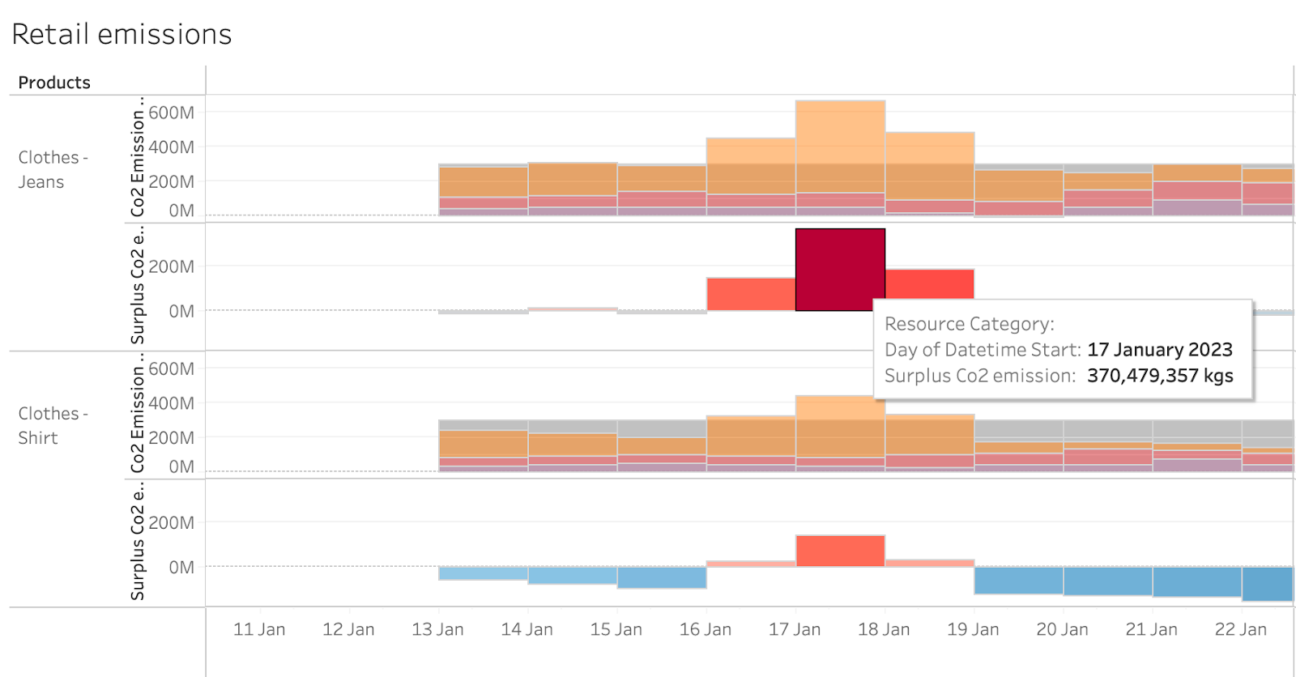
The worksheet below is a time-series graph periodically showing the emissions per product.
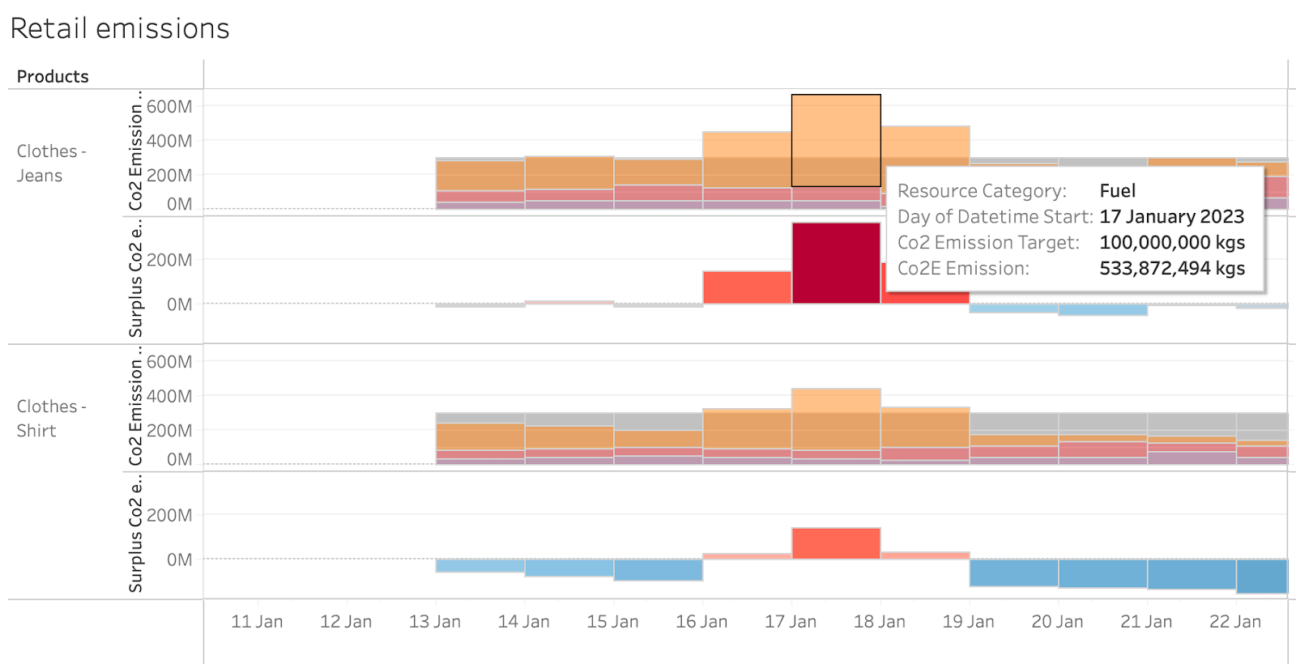
We have set an emission target per product. So that, we can quickly identify whether the industry is within the target range or exceeding the target for the number of emissions. The below graph shows you the surplus emissions in the same time-series graph.
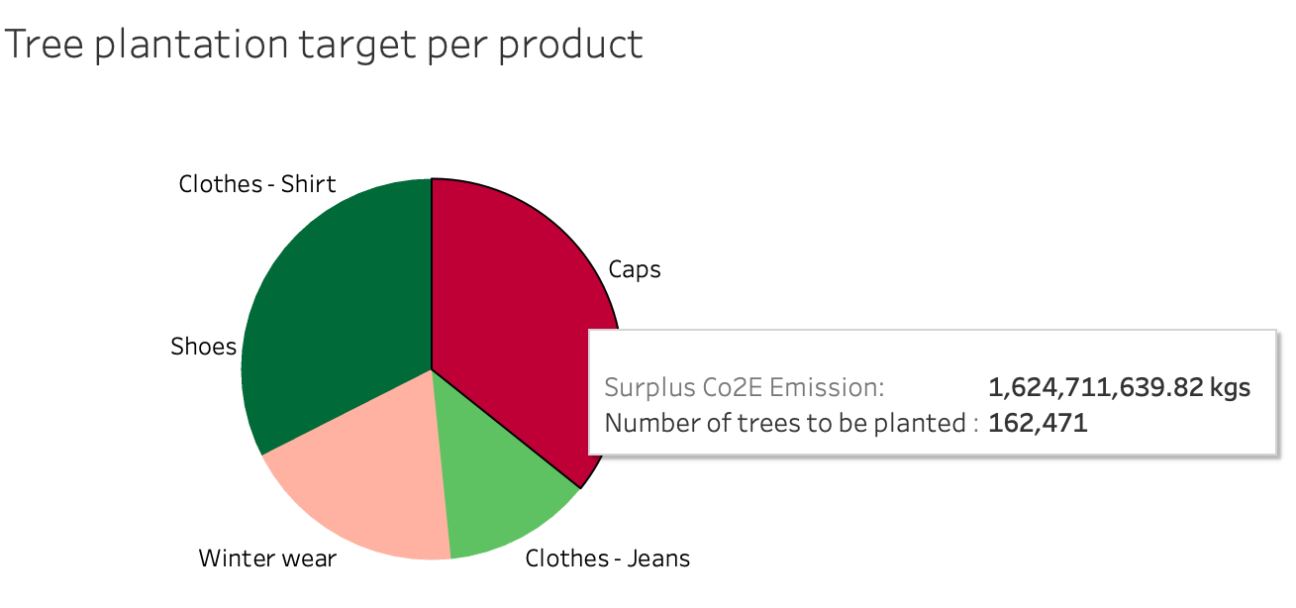
So depending on the above graph, a new feature has been created in this use case which tells the number of trees the retail industry needs to plant for the surplus emissions contributed by each product. A simple calculation of (Surplus CO2 emitted / 1000) has been applied for the result.
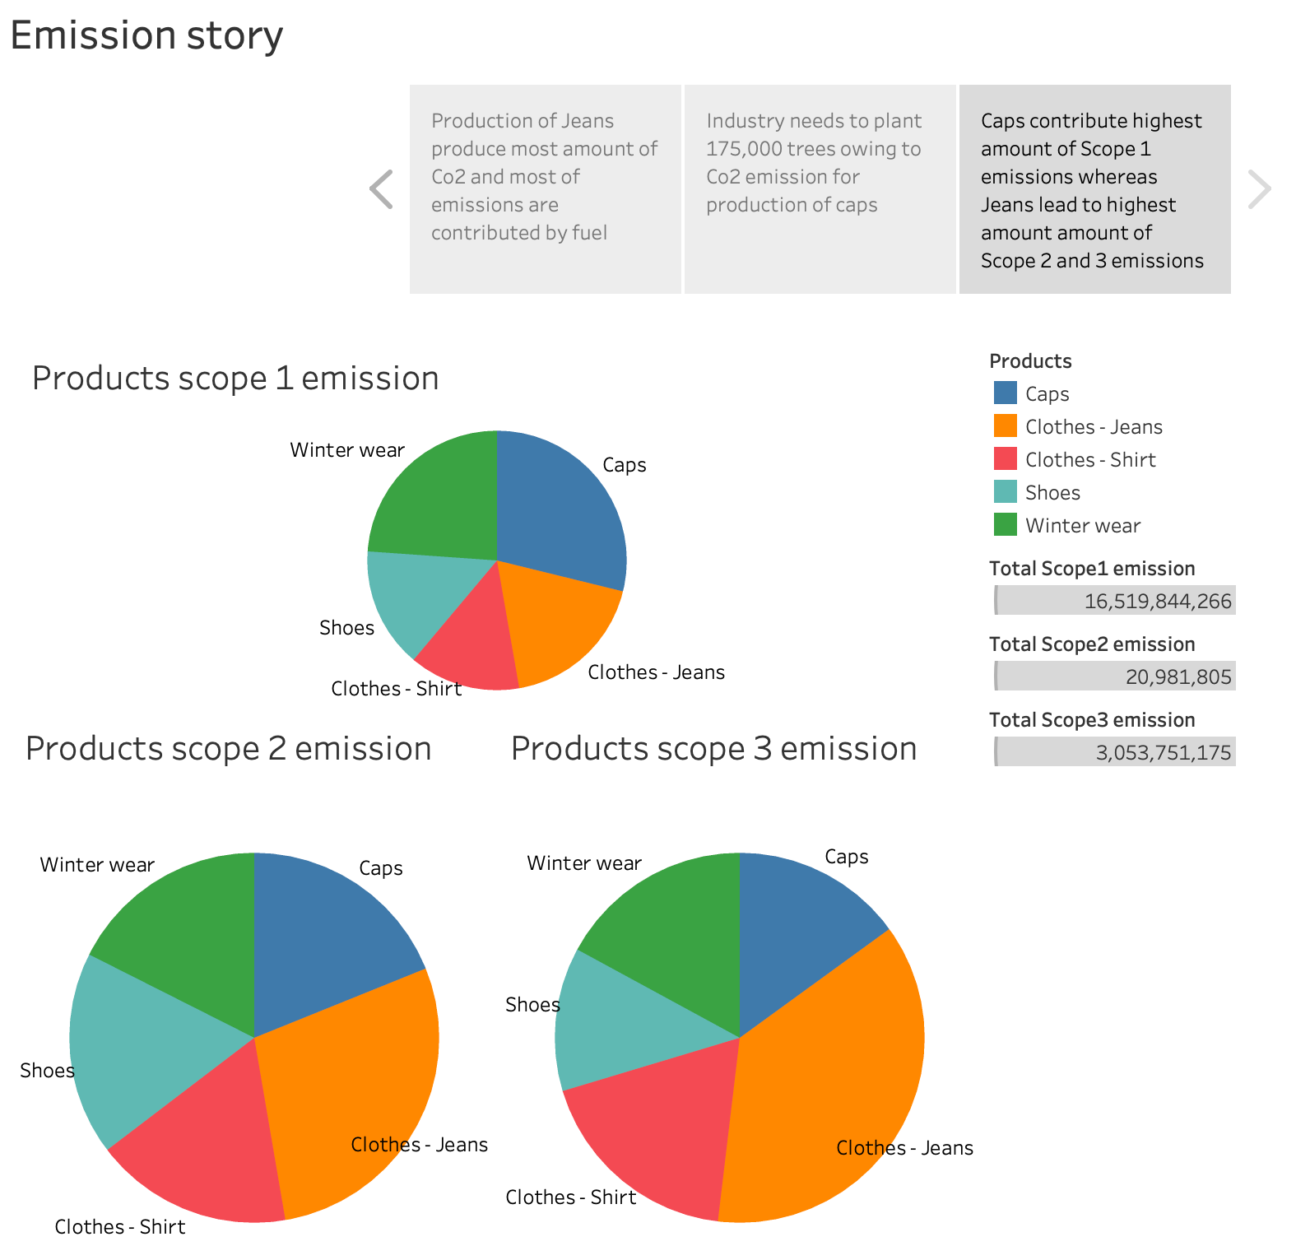
Further Emissions can be broadly categorised into three scopes.
- Scope 1 emissions: Are direct emissions the industry produces. For example, “running of store-owned generators and boilers and relevant emissions”.
- Scope 2 emissions: Are indirect and not directly produced by the industry. For example, “emissions from electricity production which the retail stores consume”.
- Scope 3 emissions: Are all other indirect emissions sources like waste disposal, raw materials, overall MRO etc.
Below is a Tableau Dashboard story highlighting that “Caps contribute the highest amount of Scope 1 emissions whereas Jeans lead to the highest amount of Scope 2 and 3 emissions.”
Conclusion
In this blog, we have discussed:
- What tableau is,
- The benefits and features of Tableau,
- The Tableau lifecycle,
- Possible use cases of Tableau,
- And a use case in Devoteam Sustainability.
The sustainability use case shows how the emission data has been used to create worksheets showing time-series emissions for the Retail industry. A target emission is set manually for each product, and Tableau also shows the surplus CO2 emission on the same graph.
An exciting feature shows the number of trees that need to be planted to neutralise the surplus CO2 emitted for each product to proceed towards the goal of an Eco-friendly and Net Zero emission industry.
To conclude, in today’s world, data is more critical than ever before. Every organisation, big or small, needs to make data-driven decisions to succeed. But with so much data available, it can be overwhelming to make sense of it all. That’s where Tableau comes in.
Tableau is a powerful data visualisation tool that allows you to explore, analyse, and share data easily. With Tableau, you can quickly connect to various data sources, from spreadsheets to cloud databases, and transform raw data into actionable insights.
But Tableau isn’t just about creating pretty pictures. It’s a powerful analytics platform that allows you to dive deep into your data and uncover insights you never thought possible. You can publish your visualisations to Tableau Server or Tableau Online, and your team can access them from any device, anywhere, at any time. And with Tableau’s collaboration features, you can easily share your insights with others in your organisation, whether in the same office or on the other side of the world.
To hear more about Tableau, please visit: Devoteam S Platform
Sustainability: Sustainability – Wikipedia
Why Net Zero: Net zero: why is it necessary?
Salesforce Net Zero: Net Zero Cloud Overview – Salesforce.com
Einstein Analytics and Tableau: Bringing together Tableau and Einstein Analytics
References :
Data Insights: Data Insights | Tableau
Tableau Desktop: Tableau Desktop | Connect, analyse, and visualise any data
Tableau Server: Tableau Server | Governed, self-service analytics at scale
Tableau Cloud: Tableau Cloud | Fast, flexible, and easy analytics in the cloud
Additional links :
Mulesoft Composer – If you are planning to use MuleSoft Composer for your business or want the help of our experts for a different project, then our team is available to help. We have a range of services available that help to grow your business.
Please visit our website: Devoteam S Platform
Find our blogs at MuleSoft Composer – Part I – Devoteam S Platform, MuleSoft Composer – Part II, MuleSoft Composer – Part III – Devoteam S Platform.

