Executive Summary
DORA metrics measure software development and operations (DevOps) performance to improve time-to-market and product reliability. Until now the focus has been mainly on why these metrics are useful.
This post will delve a bit deeper to discuss how to collect these metrics in an enterprise IT environment.
Introduction
Most of us working in DevOps know, or should know, about the DORA (DevOps Research Association) four key metrics, and why they are useful.
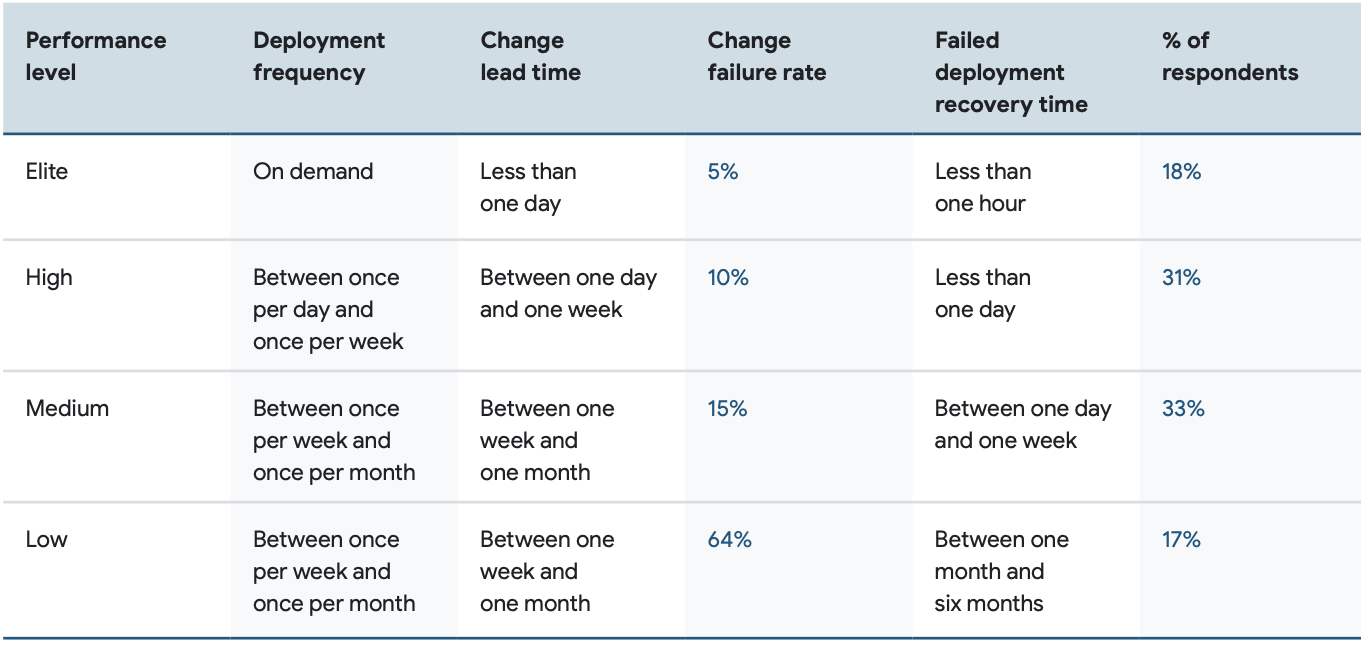
The four key metrics are
- Deployment Frequency — How often an organization successfully releases to production
- Change Lead Time — The amount of time it takes a commit to get into production
- Change Failure Rate — The percentage of deployments causing a failure in production
- Time to Restore Service (or Failed Deployment Recovery Time) — How long it takes an organization to recover from a failure in production
This post will not cover the meaning of these metrics, nor whether these are the correct metrics to measure DevOps capability, nor whether qualitative or quantitative metrics are better. Those topics are covered in many blogs elsewhere (see links at bottom). What we are interested in is how to collect these metrics in a large enterprise.
What are we measuring?
While the four metrics seem straightforward, it’s unclear what exact entities we should measure? The longer definitions for the DORA metrics all begin with “For the primary application or service…”. So it feels like the metrics should be based on applications and services. Are they the same thing?
Do we source these metrics from a code base, or several code bases? From a DevOps tool? From a IT Service Management tool? Does it matter?
The individual metrics raise further questions:
- Deployment Frequency – What are we deploying? A code base, a product, a service, an application?
- Change Lead Time – Changes to what? A code base, a product, a service, an application? And how do we measure Lead Time?
- Change Failure Rate – Where do we track failures? Are failures the same as incidents? Do we source this data from an incident management system? Or a bug tracking system? How do we attribute a failure to a change?
- Time to Restore Service – How do we know when a service is down? And when it went down? Where do we source service availability metrics? In a service management tool? Or an alerting and logging system?
DORA Metrics Collection Architecture
At the enterprise level, it is important to have a good DORA data collection architecture. This ensures that different services and applications measure DORA metrics consistently, and allows for a centralised collection, aggregation and reporting function.
There are numerous ways to architect the collection of DORA metrics, and many opinions.
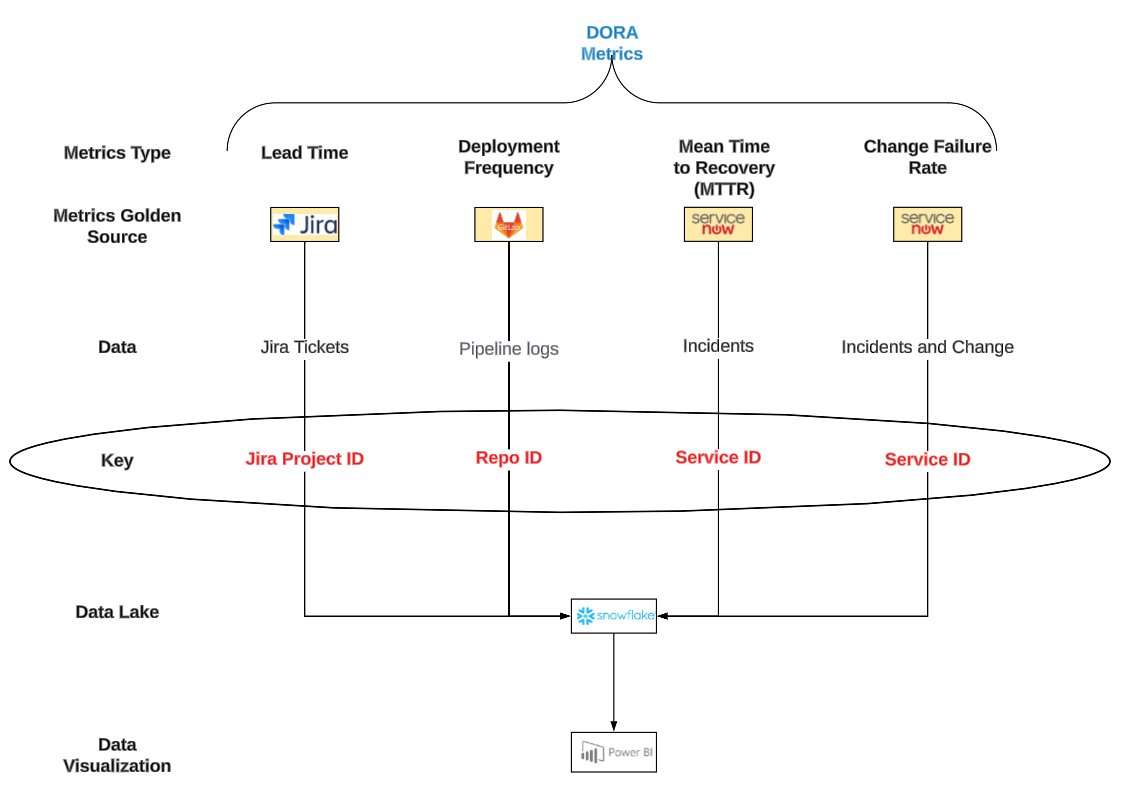
Regulatory DORA Metrics Collection Architecture
The architecture below represents a standard approach to collecting DORA metrics in regulated environments, such as financial services. This architecture relies heavily on ITSM tools (such has ServiceNow and Jira Service Management) as these tools are the golden sources of change and incident data.
ITSM tools hold information as to whether a service is functioning properly, and how long it takes to recover if there is an outage (MTTR). Furthermore, a software deployment is a “change” from an ITSM point of view therefore a change record will be created in the ITSM tool. Change failures are “incidents” and incidents are also tracked in the ITSM tool. If regulators wish to query a change or incident that has caused issues affecting the industries they regulate, they will look at the ITSM tool as the system of record – who agreed the change, when it happened, the rollback or recovery procedures, and the success or failure of the change.
Hence regulated industries prefer to use IT Service Management tools to harvest DORA metrics.
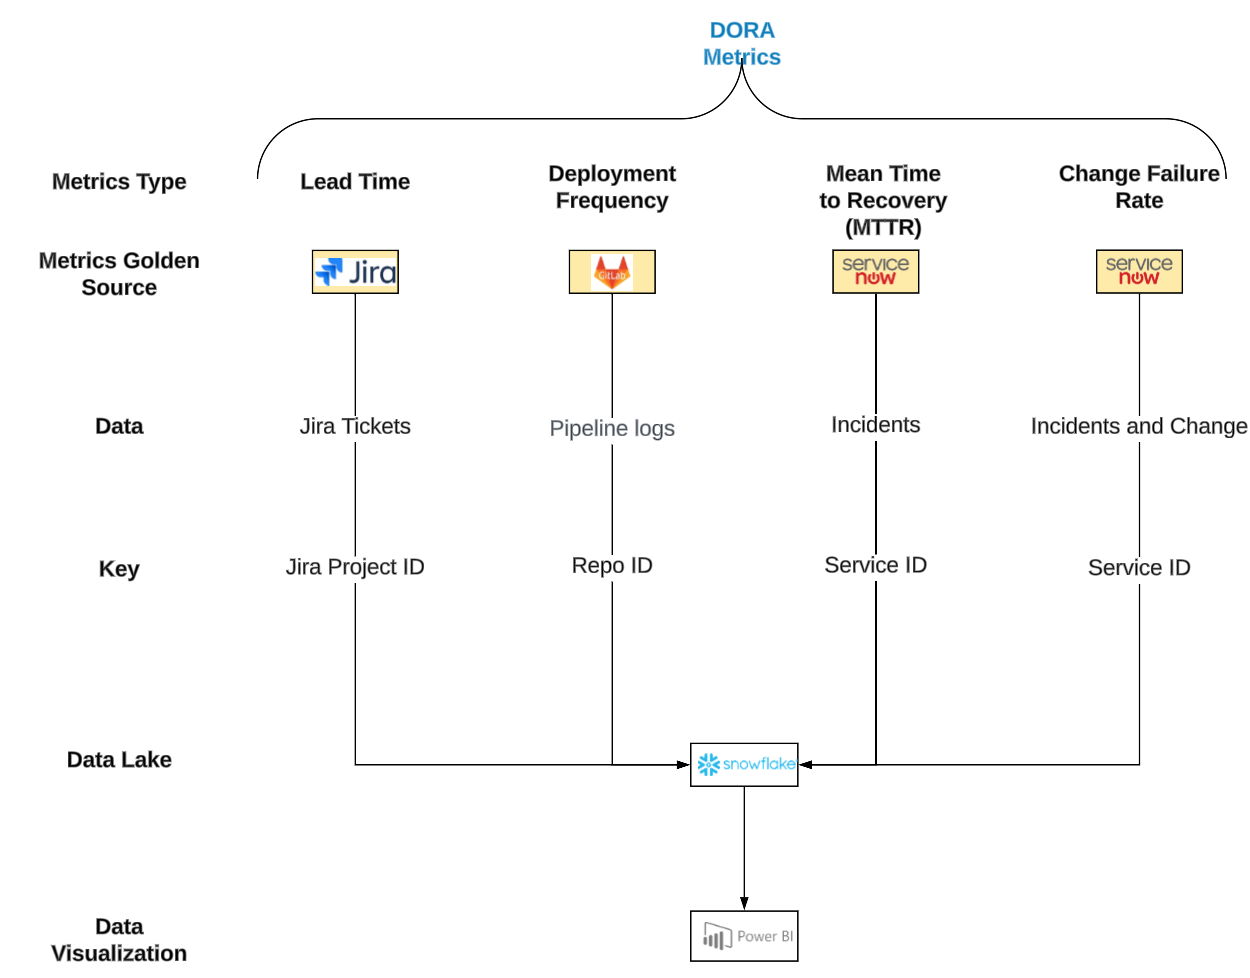
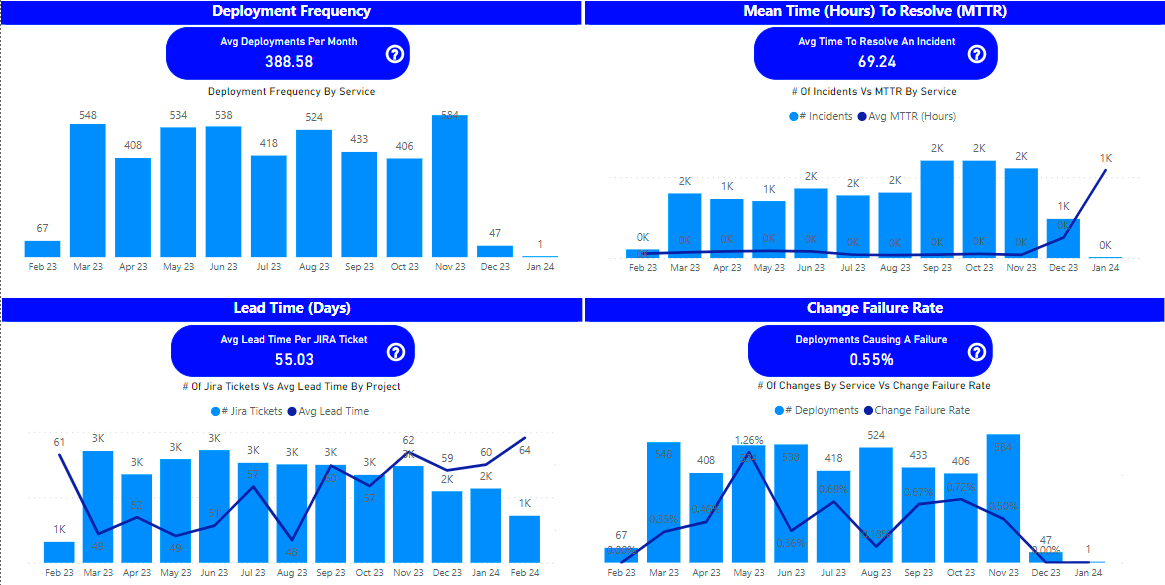
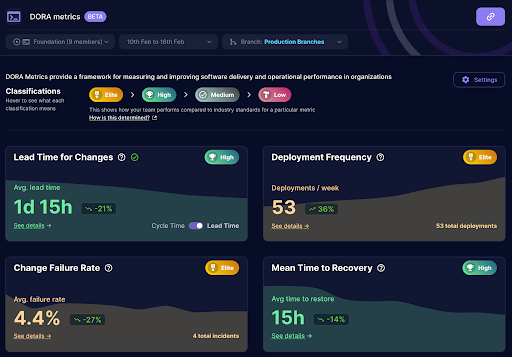
Example of an enterprise based DORA metrics dashboard
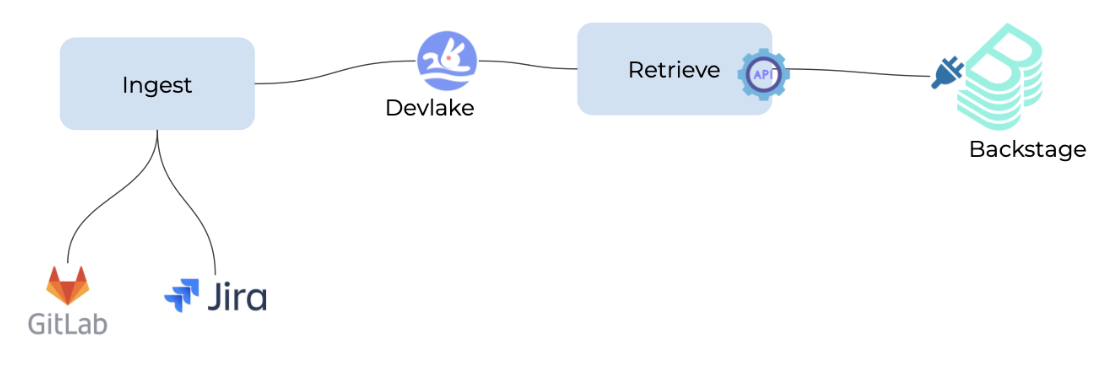
Developer-led DORA Metrics Harvesting Architecture
Developer-led metrics collection is often less interested in ITSM based metrics around change and incident. They rely more on CI/CD pipelines to produce the metrics, particularly around deployment frequency (as CD pipelines do the actual deployments) and lead time (based on the git commits that triggered the pipelines).
Here is an example architecture used by the OpenDORA project:
Example of a team based DORA metrics dashboard
Considerations when architecting DORA Metrics Collection
The sources of DORA metrics data vary for each of the four metrics:
DORA Metrics Data Sources
Deployment Frequency
Developers typically argue that deployment frequency measurements should come from the deployment tool. Operations people may counter that deployments are changes to production, and hence should be measured based on production change records which come from a Change Management tool.
In other words, do you measure the deployment of the change, or do you measure the change record that is raised in an ITSM based tool? Regulated industries will typically look to the ITSM tool as the system of record for production changes.
Change Lead Time
There are differing views on the definition of Lead Time, and numerous debates around how to measure it.
If Lead Time if measured by the length of a Jira ticket, say from creation to completion, then Jira will be your data source. If Lead Time is measured from a git commit to a production deployment (as per the DORA defintion), then the git repo and CI/CD tool will be your data source.
Fundatmental to measuring Lead Time is your Definition of Done. For me, lead time is not complete (done) until the change is in production and being used by customers.
Change Failure Rate
Changes (i.e. deployments) may be tracked in one system (e.g. a CI/CD system). Failures are usually captured as incident tickets and may be tracked in a different system (e.g. an ITSM system). Linking the incident to a change is not always straight forward.
An incident may coincidentally occur shortly after a new change, but have nothing to do with the change. Furthermore a first line support person that raises an incident ticket may have no awareness that the incident is due to a recent change. There may be no indication on the incident ticket that it is related to a change.
One way to overcome these issues is to make an assumption that an incident that occurs within, say, three days of a change, is probably a result of the change. This is usually a close enough approximation.
Time to Restore Service
For this measure we need to know when the service became unavailable until it is again available to customers. Understanding when the service became unavailable may be measured from the time of the first customer complaint, or when an incident ticket is raised by a support engineer, or when an error is raised in a logging system.
The most important point is to make sure there is consistency across services and applications around how this is measured.
DORA Metrics Data Keys
Once collected, the next challenge is joining data across sources. Taking the example architecture, we see different components use different data keys – project id, repo id, service id. How do we consistently map these for an application or service?
Ideally one service would have one code repository and one Jira project, but things are rarely that simple. Sometimes a service is built from several code bases. Sometimes one code base is used by serveral services. The same goes for Jira projects.
This is where things get messy and there is no easy answer to this problem. There are essentially three options in decreasing order of usefulness:
- In an ideal scenario. one service would have one code base and one Jira project. Then there is a simple mapping exercise to map the project to the service and code repo.
- The second best option is having your code repos and Jira projects tagged with a mandatory service Id tag. Then we can join project data, code repo data and service data all on a service Id. You may end up with some many to one relationships, e.g. where more than one code base has the same service Id. In this case, a change to either code base will result in a change to the service, and a deployment of either code base with be a deployment of the service.
- If the above options are not possible you will need to find other ways to join the data that are not ideal and will require workarounds.
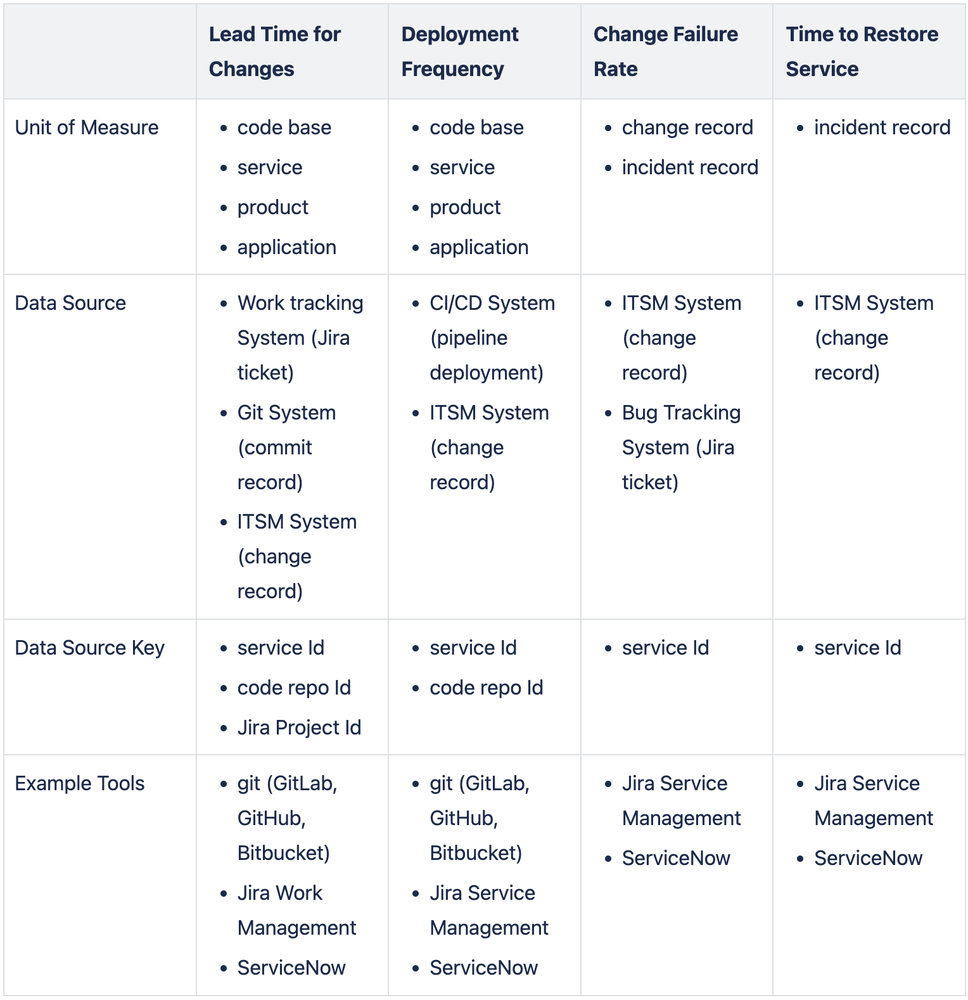
DORA Metrics Sources and Keys Summary
Conclusion
We’ve seen that collecting DORA metrics can get complicated in an enterprise with multiple services and applications. The data required for DORA metrics can come from a number of different tools. The data can be keyed using a number of different data keys. Joining the data together to present a coherent and consistent view across applications and services is non-trivial.
Getting this right provides many benefits. Automating and centralising DORA metrics harvesting can:
- remove cognitive load from developement and operations teams
- ensure consistent ways of measuring and reporting across the enterprise
- enable aggregation of these metrics (see Enterprise DevOps Governance) for higher level reporting
Glossary
DORA – DevOps Research Association
ITIL – Information Technology Infrastructure Library
ITSM – Information Technology Service Management
What is a Service?
Service is a loaded term used in product names (ServiceNow, Amazon Web Services), frameworks (IT Service Management), legal documents (Service Level Agreements), and measurements (Service Level Objectives and Indicators). ITIL has a formal definition for service here:
“A means of delivering value to customers by facilitating outcomes customers want to achieve without the ownership of specific costs and risks. The term ‘service’ is sometimes used as a synonym for core service, IT service or service package.”
DORA Open Source projects
There are several open source projects for DORA metrics collection. They have various collectors for various tools.
Apache DevLake – https://devlake.apache.org/docs/Overview/Roadmap/
Devoteam OpenDORA – https://github.com/DevoteamNL/opendora
Four Keys – https://github.com/dora-team/fourkeys
Hygieia (from Capital One) – https://github.com/Hygieia/Hygieia
https://github.com/mikaelvesavuori/dorametrix
https://github.com/topics/dora-metrics
More on DORA
https://dora.dev – the main site for DORA metrics
https://www.thoughtworks.com/radar/techniques/four-key-metrics
https://martinfowler.com/articles/measuring-developer-productivity-humans.html
https://github.com/mikaelvesavuori/dorametrix
https://github.com/topics/dora-metrics
More on DORA
https://dora.dev – the main site for DORA metrics
https://www.thoughtworks.com/radar/techniques/four-key-metrics
https://martinfowler.com/articles/measuring-developer-productivity-humans.html

